Leadership
 Culture
 Customer Experience
 Strategy
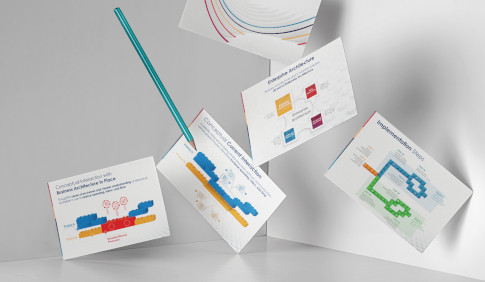
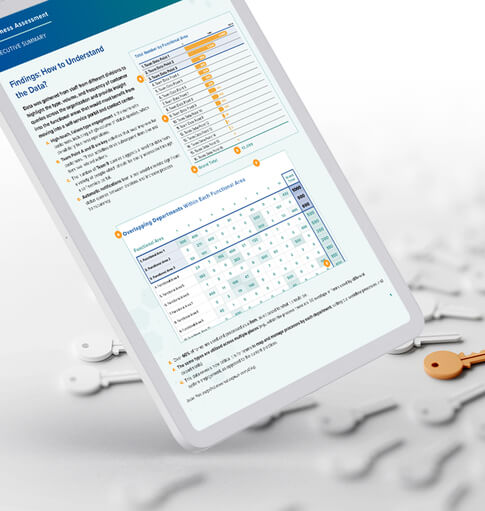
We talk about data at The Clearing – and in this blog – quite often. Why? Because data are the hard facts that help us uncover insights, tell clear stories, and make smart decisions. However, asking your stakeholders to understand what the data is telling them isn’t as simple as showing them a spreadsheet. Sometimes, it can be hard to decipher what the data means or what its consequences are without context or help. This is why the partnership between data experts and visual consultants is critical.
At The Clearing, we pride ourselves on that partnership – in fact, our visual interpretation of data has become something we’re known for. Our data team uncovers the insights and our visual consulting team works with them to turn it into a clear, compelling, easily digestible story. This is a win-win: it helps our consultants illustrate a change narrative to our clients and enables our clients to more effectively engage their stakeholders.
Insights Only Matter if They’re Accessible
I’ve written previously on the importance of accessible design. Just like designing in a way that is accessible benefits everyone, ensuring your organization’s data and corresponding insights are accessible to all benefits every team member. Of course, not everyone is an Excel wizard, which is where the visual side of data interpretation comes in. Similar to designing an accessible website, creating visuals with the data enables everyone to make their own insights because they can understand the data.
As a leader or data professional, investing in the visualization of data can be game-changing. Rather than spending time explaining how to read the data, great visuals allow you to focus on tasks like helping people use the data effectively – such as making strategic decisions, improving customer service, or increasing operational efficiencies.
Insights Are in the Eye of the Beholder
As a leader, the benefits of spending time with your organization’s data are clear. However, it’s critical to remember that your view of the data is just one view. By utilizing visuals to make your data accessible, you are allowing more people to take ownership of it and make independent observations. This matters because everybody’s observations count. While everyone may be looking at the same data, each individual is looking at it from a different, unique perspective. You, as a leader, will likely have a different insight into what a data set means versus a team member who is in the weeds every day.
For example, if there’s a spike in the data it’s important to share those insights across teams and levels. What one person may see as an anomaly, another person may identify as a crucial bottleneck that is preventing your organization from efficiently meeting its mission. So, it’s important to have meetings or facilitate other ways to collaborate around your organization’s data, with great visuals being the equalizer making that possible.
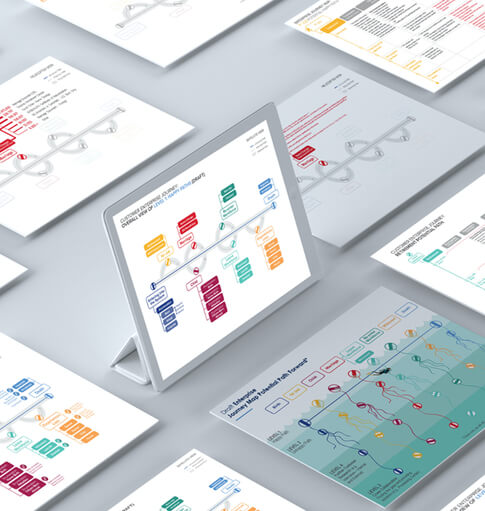
Data Visualization in Practice
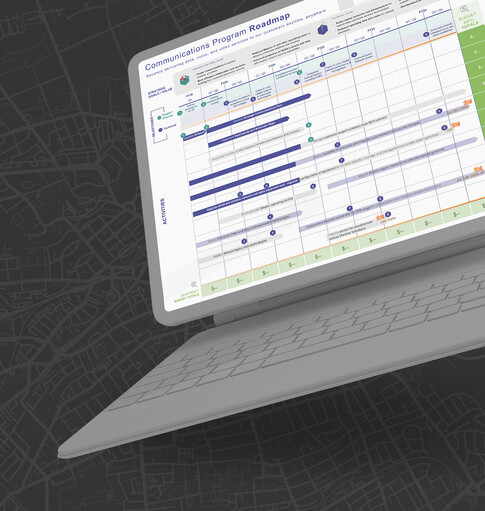
When people think about the visual side of data, things like graphs and charts come to mind. And those are a big part of this discipline. However, taking those visuals and partnering with our data team to turn them into a story that drives actionable insights and betters the employee or customer experience is where the real reward is. Let’s review an example of the benefits of easily consumable, visualized data in practice.
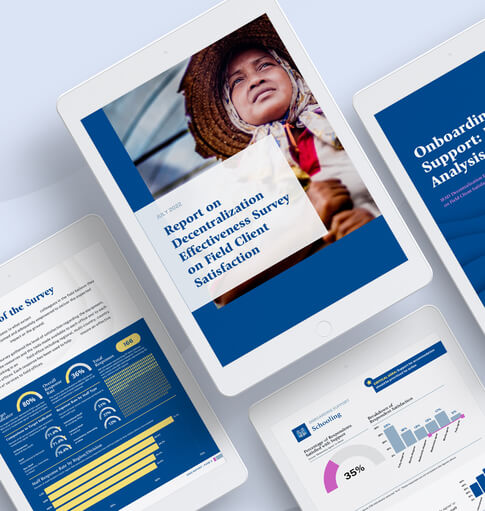
Recently, a division of a federal agency we work with needed help tracking and illustrating team member capacity, tasks, and workload. This division functions as a service for the larger agency, so it gets requests for work from across the organization.
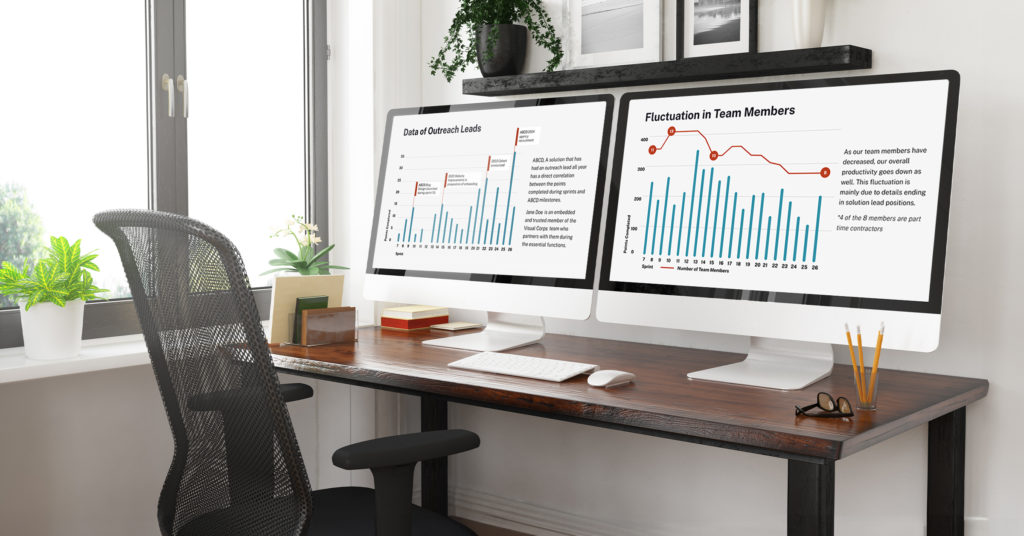
Working with The Clearing’s data team, we created an automated, visual-centric dashboard that allows leaders to quickly get a handle on what’s happening today while more effectively planning for the future. Here are examples of how it’s improving operations, employee experience, and planning.
- Capacity Control: Using data and employee feedback, the agency identified a specific limit of tasks assigned to each employee. Past this point, employees reported feeling overwhelmed. So, a key part of our dashboard displays the number of tasks assigned to each employee with reminders to connect with employees who are past the limit to potentially redistribute work. This helps improve employee experience while ensuring balls don’t get dropped due to capacity issues.
- Categorizing Requests & Division Needs: Every request is tracked and categorized by type and what department it came from. These requests are then neatly displayed so leaders can better understand where the division’s workload is coming from and what types of requests are most frequent. This feature has allowed leaders to more effectively plan and staff in both the short and long terms.
- Time-Saving: By automating this reporting and making it easily digestible, it’s freeing up staff to focus on the mission. First, this data used to take an employee four hours to pull – meaning it wasn’t readily available, was subject to human error, and took that person away from more meaningful work. Second, because it is displayed in an intuitive visual format, more team members can interpret and use the data without requiring a data expert to walk them through it.
Perhaps the biggest indicator of the dashboard’s success – and most ringing endorsement for great visual interpretation of data – however, are the requests that have come in from other departments to build similar products for their teams. If you want to know how to better utilize your organization’s data, or simply make it work harder for you and your team, reach out – our team of visual consultants and data experts is always ready to chat.

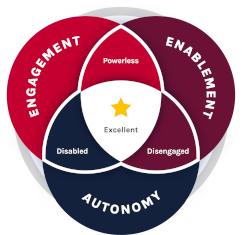 The Clearing’s Employee Experience
Improvement model, adapted from Itam
& Ghosh, 2020, focuses on three objectives:
The Clearing’s Employee Experience
Improvement model, adapted from Itam
& Ghosh, 2020, focuses on three objectives: