Think of Power Mapping as an organizational chart (aka an “org chart”) on steroids. A leader can look at an org chart and get a high-level understanding of an organization. However, a traditional org chart doesn’t provide insight into the subtleties, personalities, and power dynamics that truly explain how an organization works. This is where Power Mapping can be helpful. Power Mapping is a tool we use to analyze the networks and power dynamics that make organizations tick and how they can be used to achieve objectives. A leader who understands these networks will have better insight into how work gets done and how they can be leveraged to maximize organizational performance.
How to Create a Power Map
There are four key steps for creating a Power Map. We’ll take a high-level look at each step using an example so you can visualize how Power Mapping could come to life in your organization. For our example, imagine there is a reorg where two divisions are being consolidated under a new leader. The new leader must figure out how to maintain delivery, improve coordination, and minimize disruption as employees navigate through the transition. Here’s how we can use Power Mapping to help a leader tap into existing networks to support the change.
Set your goal.
First, decide what you want to map and who needs to be involved to make it happen. The key is not to try and boil the ocean. For example, it is often more effective and efficient to Power Map the structure of a specific division of an organization than the entire leadership system. When considering who to include, use the Clearing PRIME. You might start with a big list, narrowing it down to the names of the fewest, most important people necessary – including who to map and whose help you need to complete the map. In the case of our example, we want to Power Map the two divisions – specifically the division heads and their branch chiefs.
Define Your Power Map Measures.
Typically, we use Power Mapping to measure power and influence in an organization. You might want to identify the amount of power versus the amount of influence a leader has. We often measure this on an axis, where power is on the x-axis and influence is on the y-axis. In our example, this will allow us to understand who within the organization is best positioned to right the ship. In this case, power could be decision-making ability, while influence could be the ability to secure additional resources needed to support organization alignment.
Identify Your Stakeholder Landscape.
This is where you identify the specific people you are going to plot on your Power Map, who you will collect insights and data from, and actually collect that data. This may include decision-makers, leaders with designated titles, and informal leaders. It is important to consider not only who can move your project forward, but who can hold it back. In our example, we determine that understanding the power dynamics of the division heads, branch chiefs, and direct operational support that work cross-functionally across the organization (i.e., chiefs of staff, communications, acquisition specialists, etc.) are critical to understanding how work gets done and how the consolidation will impact employees. To collect our data, we speak with those individuals plus a selection of team members who fall under their remit.
Analyze Your Data.
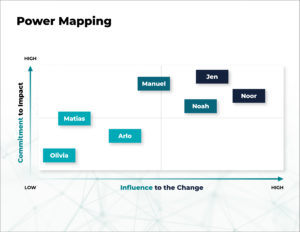
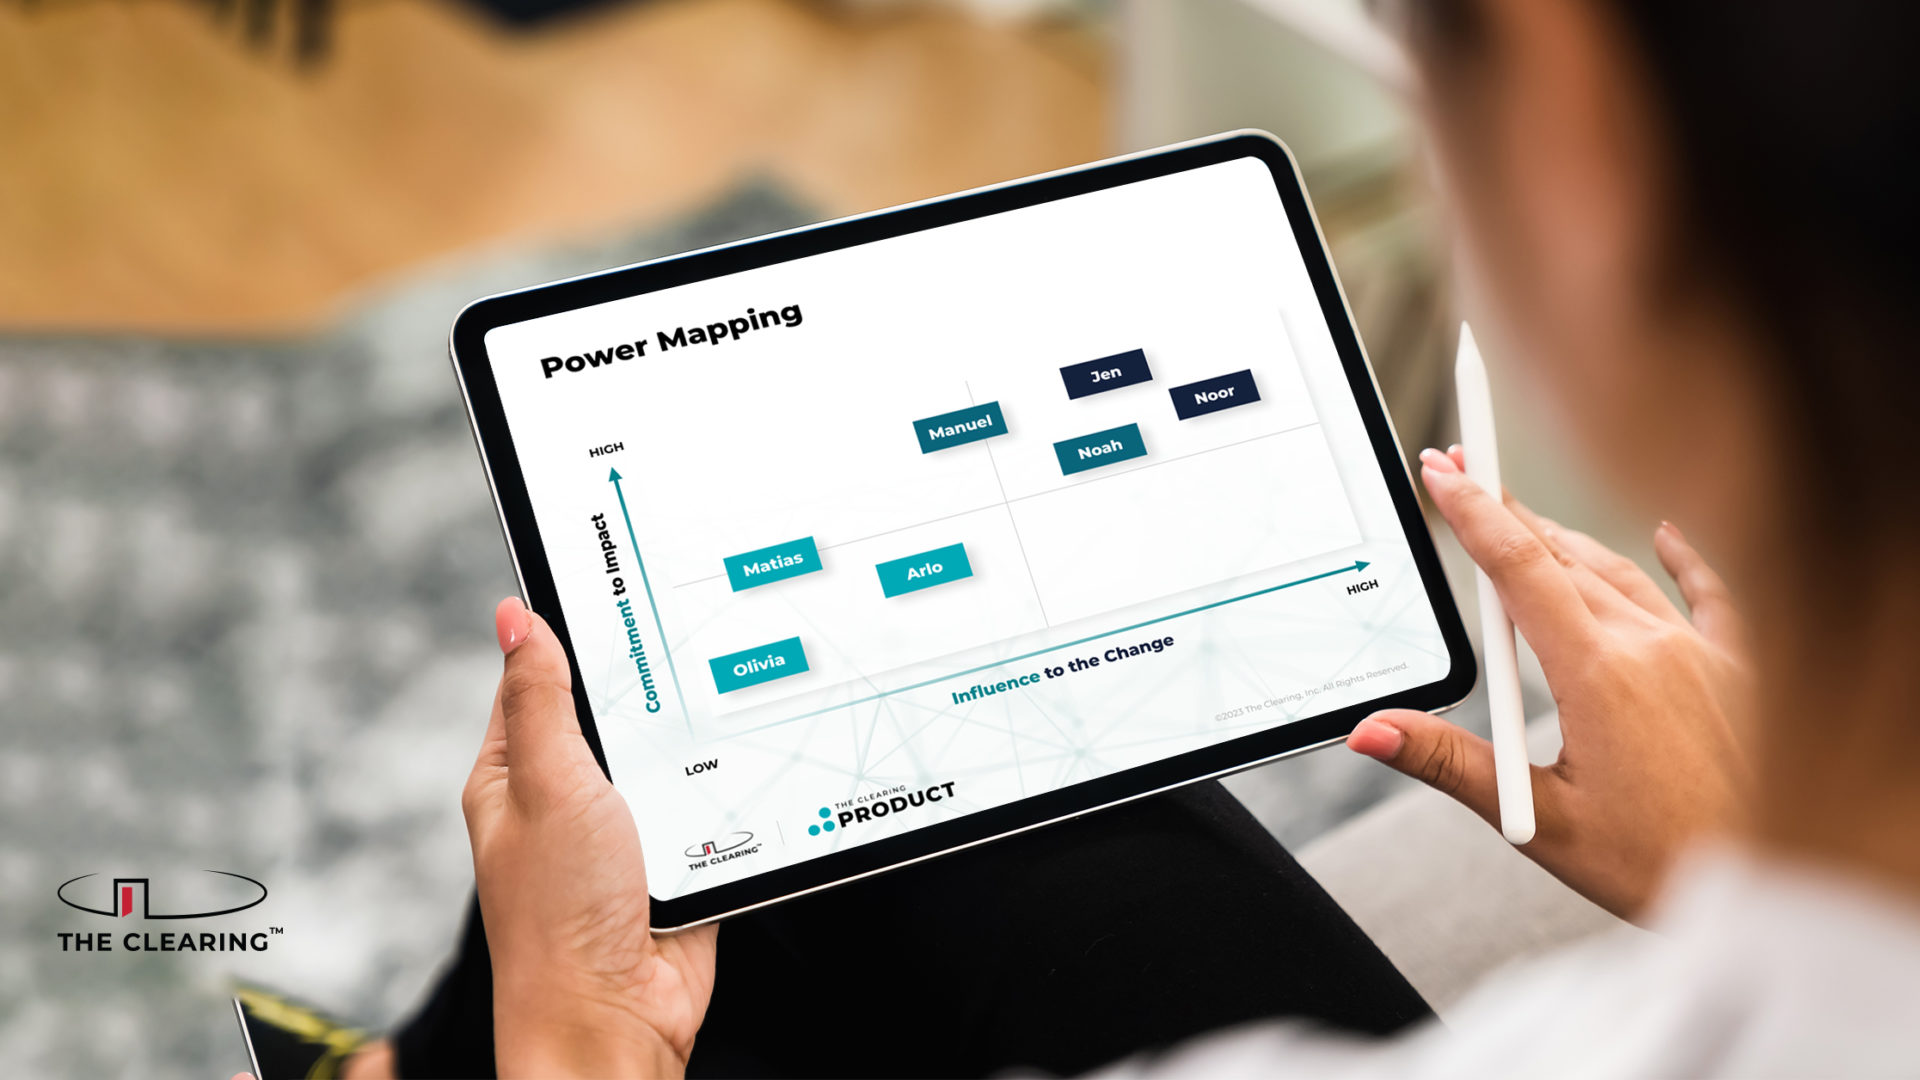
Once you have analyzed your data, place each person on the model taking into account their power and influence in the organization. You may find that in a given organization, power and influence aren’t necessarily held by the same person. As you place them, identify something about how they’re related to the organization or to the main power holder. When you’re done mapping everyone, review the names and confirm that each person is essential to the success of the effort – in our example, navigating the consolidation. If the person is not essential, take their name off the model. It’s important to focus on the people who are going to give you the biggest bang for the buck. If you have too many people, it’s harder to focus on who you really need to work with to fix an issue.
Build Your Plan.
With your Power Map in place, it’s time to brainstorm the strategy for each of those quadrants. In our example, we may have discovered that while the division head has decision-making power and influence with senior leaders, they lack influence with other employees who are important to building momentum for the consolidation. On the other hand, a branch chief may lack organizational power but used to work with some of the leadership in the other division and has built relationships and influence over workers across both divisions. You can use these dynamics to build a plan to implement the consolidation. You now know the branch chief has the ear of leaders and employees from both divisions. They can share a broader perspective and tap into their network to gather feedback and communicate to support a successful consolidation. The division head can then use their influence with senior leadership to secure a budget to support the consolidation and new initiatives that result from better coordination. It’s an empowering, eye-opening process that helps stakeholders understand how to maximize their position in the organization and drive results.
The Bottom Line
Power Mapping puts emphasis and value on the humanness of an organization. It shows that it’s not simply names slotted into roles that get things done, fix issues, and make an organization hum, but the relationships behind those names. As a leader, if you can tap into that you’ll be well-positioned to help your organization thrive in our constantly changing environment.
If you’re ready to get started with your own Power Map, click here to learn more and download our Power Mapping template, an easy-to-populate template with step-by-step guidance to help you build an effective Power Map for your organization.


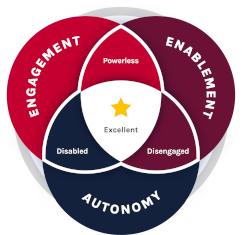 The Clearing’s Employee Experience
Improvement model, adapted from Itam
& Ghosh, 2020, focuses on three objectives:


